Water on the Web
A. Summary
Water on the Web is still under construction and will be
finished during the year 2000. In our analysis, we tried to keep apace
with the authors' site revisions, but some of our critical annotations
may no longer be applicable to the site.
1. The System
Water on the Web is a project that allows high school and college students
to monitor four Minnesota lakes. The study of fresh or saline water contained
within continental boundaries is called limnology. Limnology became a distinct
scientific discipline only in the past two centuries, when different inventions
like the silk plankton net, and improvements in the thermometer and microscopes,
made it possible to show that lakes are complex ecological systems with
distinct structures.
Today, limnology is an important factor both in wildlife habitat protection
and in water use and distribution. Limnologists work on lake and reservoir
management, water pollution control, stream and river protection, artificial
wetland construction, and fish and wildlife enhancement. (See: Lake ecology
overview, Chapter 1, Horne, A.J. and C.R. Goldman. 1994. Limnology. 2nd
edition. McGraw-Hill Co., New York, USA.)
Water quality is characterized by several variables such as water temperature,
pH level, conductivity, turbidity, and amount of dissolved oxygen.
Relations among these variables are mediated by chemical, biological, and
physical processes. For example, oxygen is produced during photosynthesis
and consumed during respiration and decomposition. Photosynthesis uses
up dissolved carbon dioxide which acts like carbonic acid (H2CO3) in water,
so that CO2 removal in effect reduces the acidity of the water and increases
pH. In contrast, respiration of organic matter produces CO2, which dissolves
in water as carbonic acid, thereby lowering the pH. (For this reason, pH
may be higher during daylight hours, when photosynthesis is at a maximum.)
Respiration and decomposition processes lower pH.
Water quality variables vary between lakes, between each lake's zones,
daily, seasonally, and with special occurrences:
-
Each lake has unique stable conditions, such as the geology hof the lake
bottom, the landuse of the environmental areas, the bathymetry, and so
on. For example, limestone leads to higher conductivity because of the
dissolution of carbonate minerals in the basin.
-
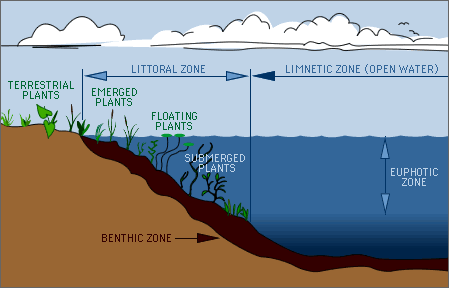
Within each lake are different zones, as illustrated in the picture. Most
water quality variables are affected by depth. For example water temperature
is higher near the surface than at the bottom of the lake.
(http://wow.nrri.umn.edu/wow/under/primer/page10.html)
-
Day to day variations in air temperature, amount of light, etc., affect
water quality variables.
-
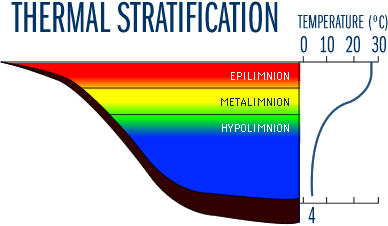
Seasonal variations such as in air temperature and amount of light affect
water quality variables. For example, many lakes are stratified by
different temperatures at different depths. Warmer water has lower density,
so it stays at the top of the lake and forms upper layers. When air
temperature drops in autumn, lake temperature becomes colder and more consistent,
and the layers dissipate. This is called the fall/spring turnover. You
find more information in the lake
ecology primer of Water on the Web. The chapter density
stratification includes movies that explain the turnovers. The cartesian
graph on the right below shows the water (lake) temperature (horizontal
axis) against depth of water level (down the vertical axis). The left can
be interpreted as a cut trough the lake, where the temperature is visualized
by color. This is an ideal picture as real lakes would not have a constant
temperature on every level across the whole lake.
(http://wow.nrri.umn.edu/wow/under/primer/page5.html)
-
Special events such as pollution, thunderstorms, etc., will affect water
quality variables.
For more information see Introduction.
2. Learning Goals
The primary goal of Water on the Web is that students come to understand
and be able to solve real-world environmental problems. In the first version
of Water on the Web, the curriculum authors gave five answers to the question
"What will students gain?"
-
A better understanding of lake and watershed processes and management issues
-
Practical experience studying actual resource management questions on real
systems in real time
-
A better understanding of the relationship between classroom science and
real-world technology
-
Training in new and emerging technology
-
Interrelationships with private industries and agencies
Curriculum lessons are divided into major sections which reflect the objective
of students coming to understand the scientific process: knowledge base,
experimental design, data collection, data management and analysis, interpretation
of results and reporting of results.
Water on the Web is perhaps unique in providing three different versions
of the curriculum: one for the teachers and two different versions for
the students, namely "studying" lessons and "investigating" lessons.
Studying lessons allow the students to learn and apply concepts through
direct, guided experiences. Investigating lessons provide more opportunities
to discover the concepts and involve more problem-solving.
There are mainly two different types of lessons across both the studying
and investigation lessons: in one, students explore properties of single
variables such as conductivity, pH, etc. These lessons always start with
laboratory work through which the students explore some typical characteristics
of the variable. Afterwards they study the variation of the variable in
a lake on the basis of given data. In the other type of lesson there are
broader topics, such as heat budget of lake, rain storms, landuse and
lake turbidity. These lessons are intended to give students insight
into the complex ecological ecosystem of a lake as a whole.
For more information see Introduction
and structure
of the curriculum.
3. Available Data
All data are collected by scientists through five Remote Underwater Sampling
Stations (RUSS) in four Minnessota lakes (Ice Lake, Lake Independence,
Grindstone Lake and two in Lake Minnetonka).
Different types of data are available (The italized phrases refer to
the respective headings of the data
page):
-
raw data (RUSS data)
-
already organized and aggregated data, partly enriched with graphical displays
(Lake Trends: Surface trends, heat and oxygen budget)
-
information about the environment of the respective lake (Environmental
Data: Weather information, GIS Maps, Landuse Maps)
The data archive is reasonably structured. You can get all data as an EXCEL
spreadsheet, and some data are available in HTML format. You can find in
the data archive information about missing data, as well as dates of calibrations
of the RUSS-unit.
Raw data are available for the entire period since the RUSS-unit was
installed in the lake: for Ice Lake since January 25, 1998, for Lake
Independence since June 14, 1998, for Grindstone Lake since August 1, 1999
and for Lake Minnetonka since May 2, 1999. You can get weekly data or the
complete archive for each lake.
For more information about the data see data
and data archives.
4. Supports for Data Analysis
Software
The authors of Water on the Web provide all data in EXCEL format. The EXCEL
spreadsheets with the raw data (weekly RUSS Data) already include
prepared charts. The
Using
WOW data with Excel tutorial explains how to use the prepared EXCEL
spreadsheets.
In addition to EXCEL the authors have developed three Data Visualization
Tools: the profile plotter, the color mapper, and the DxT profiler (Depth
versus Time). The students can learn how to use these tools in the
Using
WOW Data Visualization Tools Tuorial.
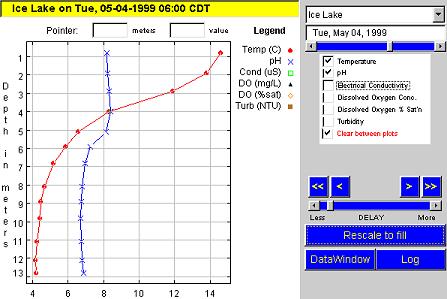
The same principle underlies both the profile plotter and the color
mapper. Measurements of a freely choosable point in time are represented
in a somewhat unusual coordinate system. Usually we expect to see a function
represented in a coordinate system with the independent variable placed
on the abscissa and the values of the measured variables on the ordinate.
This plot (see example below) is different. The abscissa shows the measured
values, while the ordinate shows depth with zero at the top. But once you
get used to this kind of graph, you recognize the advantage of the profile
plotter. As if you had sliced the lake, it displays the values of the different
variables at different layers.
The color mapper (see example below) supports the display of two variables,
one of them as a line plot and the other by means of a color map where
the coordinate system is colored according to the measurement of this variables.
A legend above the coordinate system shows the corresponding values of
the color scale.

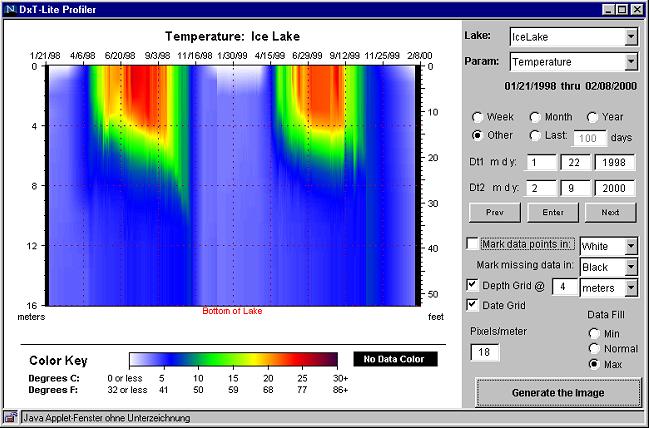
The DxT Profiler, shown below, is an extension of the color mapper.
A coordinate system displays water depth (y-axis) and time (x-axis). Every
point has a coordinate (depth/date). The time can be chosen freely. The
area of the coordinate system is colored, similar to the color mapper,
according to a color scale. The colors are now dependent on time and depth
of the lake.
For more information about software see tools
for data analysis.
Subject matter knowledge
In the lake
ecology primer (available online), the developers of Water on the Web
summarize the important subject matter knowledge about lake ecology as
well as the relevant basic scientific laws. The primer is divided into
the three disciplines of physics, chemistry and biology. It is enhanced
by pictures, videos and hints for further readings.
The teacher curriculum includes a lot of notes with each lesson that
give background information for the given tasks as well as hints for further
readings.
The glossary is very helpful. Every scientific term is linked with
the glossary so that you can find an explanation quickly.
Data analytical knowledge, strategies
As we mentioned above, all lessons are divided into different sections:
knowledge base, experimental design, data collection, data management and
analysis, interpretation of results and reporting of results. We
suspect that this division provides a useful structure for students.
Furthermore, the curriculum authors advise students to use at most two
variables in their explorations and then to think about further external
factors, such as wind, rain, sunlight, etc. In this way, students
learn to focus their work on a subset of variables. This tack is
important, because it would be easy for even the best of students to be
swamped by the complexity of the whole ecosystem. However, we expect
that the curriculum authors are still underestimating the need students
have for strategies to deal with complexity.
Unfortunately the authors haven't yet done enough to integrate their
data visualization tools into the curriculum and suggest oversimplifications
that are not adequate for the problems. We find an example of this in the
first unit on Aquatic Respiration: the students are encouraged to
use only six measurements over a time span of six months. We show in our
own analysis below that this is simply too small a sample to use.
However, using the appropriate on-line tools the given problem can be solved
fairly easily. We will show that these Data
Visualization tools support a much better analysis than does EXCEL
or any other statistics software.
Subject matter questions to be answered by data analysis
The Water on the Web curriculum includes two different types of lessons
that lead to different subject matter questions. In one type, students
come to know the properties of the various variables in different lessons.
There are units about dissolved oxygen, conductivity, water temperature,
and pH. The intent of these units is that students gain a deep
understanding of all variables measured by the RUSS unit.
In the other type of unit, students begin with a subject matter question
and try to answer it using data. For example, the unit Rain storms,
Landuse and Lake Turbidity poses the following question which involves
solving a real-world problem:
As a regional landuse planner you need to prepare a report
on how a rain storm affects turbidity values in a lake. The final report
should take a multidisciplinary perspective. That is, it should include
meteorological, landuse, and water quality factors that may influence how
a rain storm affects turbidity values in a lake.
Like this lesson, most are embedded into a real-life context.
Exemplary data analyses, expected answers
Within the teacher curriculum are notes which include model answers,
but only notes for rather narrow questions. You do not find a whole exemplary
prototypical data analyses with multiple steps and various discoveries.
The
notes also include prototypical graphs they can use. The
curriculum authors suggest to use them to motivate the students to analyze
the data. But what is missing,
and would be quite helpful, are prototypical analyses of the questions
which show a moderately complex analysis of the data. The Unit Data
Interpretation would be a good place for such a prototypical analysis.
That unit includes 16 research questions about lake water. But none
of them are answered well.
5. Our Own Exemplary Data Analysis
In our analysis we answer the research question of unit 1: Aquatic Respiration:
How does the process of respiration change the pH and DO in
the hypolimnion of your lake during the summer?
(Hypolimnion is the layer nearest to the bottom).
We have found out in our own exemplary
data analysis that the values of DO in the hypolimnion decreasing in
May, reach nearly zero between July and October, then steeply rise. The
oxygen is consumed by decomposing detritus. During the period from May
to November much detritus falls to the bottom of the lake where it's decomposition
consumes oxygen and therefore lowers the DO values. At the end of
this most productive time of the year the amount of detritus will decrease
and so less oxygen is needed to decompose the detritus. Therefore the DO
increases.
Below we summarize what we regard as the strenghts of this unit, and
also the problems and difficulties that arose for us during analysis.
Strenghts:
-
The problem is embedded in a real life context: the students are asked
to "Picture themselves as lakeshore owners concerned about DO and pH levels
in the depths of your lake."
-
The teachers notes provide the solution of the given task and explain the
scientific background in an understandable way.
-
The solution of the problem is not self-evident; to answer it, one must
look at the data. And though it is difficult, with the right tool
it is possible to get from the data relevant information to solve the problem.
-
The question raised is not overly complex and concentrates on two
variables.
-
The tools provided by Water on the Web, and in particular the DxT
profiler, are really helpful in solving the problem. They allow substantial
progress, because one can get useful displays of the data with a single
mouse click. One needs hours to display with Excel the information
that takes but a few seconds to display with the DxT profiler.
-
This unit, as all units in their curricula, can be done independently
of the other units.
Difficulties:
-
The WoW authors suggest that students select six measurements during a
time period of six months. But this particular reduction makes it impossible
to answer the question.
-
If you want to use more than these six measurements, it is hard to select
the right data.
-
The WoW authors propose using values from the bottom of the lake from the
dates of May to November. This choice has 2 difficulties: (1) The values
of DO were within the limits of the precision of measurements equal to
zero, the variation can be hardly interpreted at all!. (2) To get a reasonable
answer it is necessary to analyze a longer time period than the suggested
one in order to see substantial changes over time.
-
During these six months, there were three weeks when the RUSS unit did
not work correctly. Yet, these data are still included in the archive.
If you fail to recognize this measurement error and eliminate these values,
your graph will be cluttered with these noisy values and made harder to
interpret.
-
Some bumps in the graphs come from calibration and do not show any changes
in the value of the analyzed variable.
Summary: The main idea of this problem is excellent, and the data allow
for an interesting solution as we will show below. Unfortunately the authors
apparently did not use their own tools, such as the DxT profiler, to look
at the data with data analytical sensibility beforehand. At least, we think
this is the only explanation why the authors propose oversimplifications
with egard to the data analytical strategy .
6. Summary From the Perspective of Data Analysis
In Water on the Web, students do not collect their own data but rather
make use of data collected by scientists. While this approach to
data sharing eliminates some of the problems inherent with student-collected
data, it also diminishes somewhat the motivation to share analyses with
other schools.
The structure of the Water on the Web pages is well thought through.
Even beginners can easily find their way and not get lost in hyperspace.
All information is structured according to the four chapters "understanding,"
"data," "teacher" and "student."
The data archive is nicely structured. Data are available in various
formats and structures according to different needs. You can find background
easily. The lessons are structured according to the same scheme, which
is a great help for teachers and students. The basic concept
about learning in science is convincing.
Water on the Web is unique in providing a wealth of data-visualizing
tools specific for the project. The profile plotter, the color mapper,
and the DxT profiler are modern data visualizing tools that are well suited
for the data and for beginning students. However, the curricula does
not yet capitalize on these tools. The lessons frequently do not
make use of the tools and often suggest methods for data analysis
that are inadequate (see our analysis of Aquatic
Respiration). However, many of the tools have been developed after
the curricula we have looked at, so we expect that the authors will adapt
the units to the new tools in the near future.
But even with the new tools, many of the activities and suggested tasks
are difficult to solve. We suggest that the support material for
the teacher would be supplemented with model solutions, especially related
to the data analysis tasks. In particular the unit "data interpretation"
would profit from such model solutions and exemplary analyses.